
THE GAMLEN DASHBOARD NOVA SOFTWARE
Can you tell the difference? Now anyone can with the Gamlen Dashboard!

THE GAMLEN DASHBOARD NOVA SOFTWARE QUANTIFIES COMPACTION BEHAVIOUR QUICKLY AND EASILY
The recently published USP Chapter <1062> Tablet Compaction Properties defines key Critical Quality Attributes for manufactured tablets. These are calculated from compaction pressure, tablet density or solid fraction and tensile fracture stress. The Gamlen® Dashboard system measures all of these parameters, and many more to provide you with complete and useful compaction data. Using our unique powder assessment system, you will be able to better understand you APIs and formulations and avoid tableting problems.
The Gamlen® Dashboard displays how a material compares with industry norms for the key parameters of compaction, lubrication and elastic recovery. The clearly defined “good” and “poor” compaction behaviour zones aid result interpretation and allow even novice users to identify problematic data. We can also set the good and bad limits to suit your company’s expectations or the particular requirements of your formulations. The graphs automatically scale to show your formulation along with the configuration ranges you use.
WHAT INFORMATION IT WILL GIVE YOU
TABLETABILITY
Will your product make a strong but porous tablet? Maximising tabletability is a key objective for formulation and process development.
COMPACTIBILITY
Is your product at risk of over-compaction? Products with very high density are much more likely to result in capping. They are also slower to dissolve and over-compaction can introduce flaws weakening the tablets
LUBRICATION PROBLEMS
Measurement of detachment (take-off) force and ejection force gives acts as an early warning system for picking, sticking and capping. The Dashboard software will help you optimise formulation lubrication.
ELASTIC RECOVERY
Is your formulation prone to capping? As the tablet emerges during ejection, the section of the tablet outside the die undergoes elastic recovery and expands. Excessive elastic recovery at this stage can cause capping.
VISUAL REPRESENTATION OF FORMULATION/PROCESS CHANGES
With the Gamlen Dashboard software you will be able to evaluate formulation and process changes at a glance and easily compare the compaction behaviour of your APIs, excipients and formulations.
MEASUREMENTS
- Compaction force/displacement
- Detachment force/displacement
- Ejection force/displacement
- Tablet weight
- Tablet thickness
- Tablet diameter
- Tablet breaking strength
CALCULATIONS
- Compaction pressure
- Detachment stress
- Ejection stress
- Tablet tensile strength
- Tablet solid fraction
- Tablet volume
- Tablet density
- Tablet elastic recovery
- G ratio
DATA DISPLAYED
- Compressibility
- Tabletability
- Compatibility
- Detachment stress profile
- Ejection stress profile
- Sawai Plot
- Elastic Recovery profile
- G ratio profile
THE GAMLEN DASHBOARD AUTOMATICALLY GENERATES ALL TABLET CQA DATA
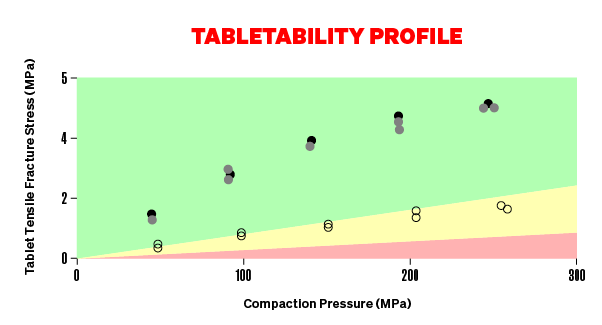
Tabletability is the dependence of tablet strength on compaction pressure. We maximise tabletability to produce a robust tablet which will withstand handling.

Compressibility describes how tablet solid fraction changes with compaction pressure. High solid fraction values hinder water penetration reducing dissolution rate.
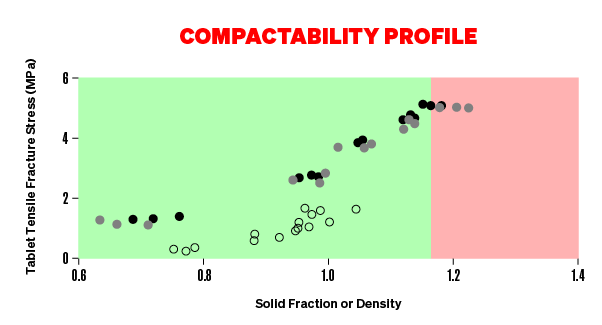
Compactability is the effect of solid fraction on tablet strength. We have to balance these properties to have strong tablets without over-compaction, which hinders the rate of dissolution.

Excessive elastic recovery causes capping in many products. We can minimise elastic recovery by selecting the right excipients.

Ejection stress is a measure of how well lubricated the formulation. Poor lubrication results in common tablet defects such as picking, sticking and capping.
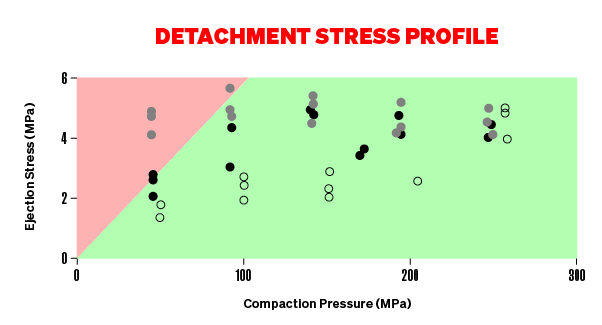
Detachment force is equivalent to take off force and is related to lubrication. High detachment stress values indicate that the formulation is at risk of picking and sticking problems.
The ejection stress vs tabletability profile provides an ideal target for the compaction behaviour. It is a simple and effective method of visualising and evaluating the effect of various changes a formulation.

Using the G-ratio simplifies your compaction data and helps you to quickly evaluate and compare different materials/formulations.

UNDERSTANDING POWDER COMPACTION ANALYSIS
Interested in learning more?
Enjoy an insightful webinar hosted by Gamlen’s Product Director, Dr. Rebecca McVicker, where you can learn more about the science and method behind effective powder compaction analysis and see our compaction analysis suite in action.