FULL COMPACTION ANALYSIS AND INTERPRETATION
Determining whether a powder will form a good tablet is a complex process.
For over a century pharmaceutical manufacturers have struggled with powder compression problems such as capping and lamination, powder sticking to punch surfaces or die wall, and insufficient tablet mechanical strength to withstand stress in downstream processing.
Now there is a new laboratory tablet testing service to help you predict and avoid common manufacturing problems. This gives you the peace of mind that your formulation works.
This will speed up your manufacturing process, reduce material costs and save you time and money. The service is ideal for manufacturers of generic products and vitamin supplements.
THIS SERVICE WILL PROVIDE DATA ON:
- Compactibilty
- Compressibility
- Tabletabilty
- Lubrication (detachment and ejection stresses)
- Elastic Recovery
- Formulation comparisons using Sawai and G-ratio plots
We not only generate data but also provide an in-dept analysis and interpretation of the data and how it relates to your project. We draw on our extensive pharmaceutical compaction experience to help you with trouble shooting manufacturing problems, change control projects and formulation development.

IDEAL FOR NEW SUPPLIER EVALUATIONS
Many clients are interested in identifying alternative API or excipient suppliers. Drivers of change may include quality or performance improvements, better assurance of GMP and regulatory compliance, increase reliability of supply or simply to reduce costs.
Switching material source involves a considerable amount and it is not always clear that the effort to qualify an additional source of supply will result in a satisfactory product.
Or testing service can definitively show that product made using a new API or excipient supplier is equivalent or not in terms of compaction. This reduces one of the major risk factors in changing a material supplier.
TYPICAL FULL COMPACTION ANALYSIS DATA
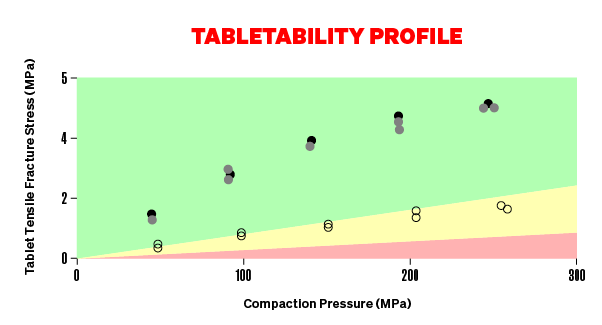
Tabletability is the dependence of tablet strength on compaction pressure. We maximise tabletability to produce a robust tablet which will withstand handling.

Compressibility describes how tablet solid fraction changes with compaction pressure. High solid fraction values hinder water penetration reducing dissolution rate.
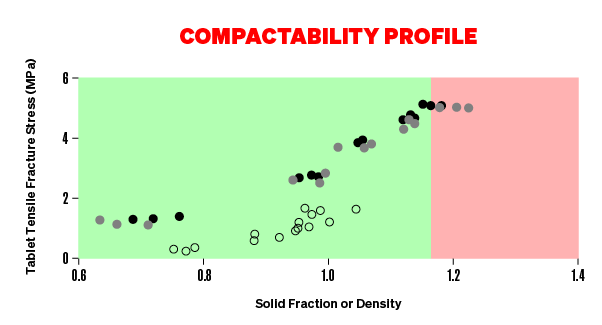
Compactability is the effect of solid fraction on tablet strength. We have to balance these properties to have strong tablets without over-compaction, which hinders the rate of dissolution.

Excessive elastic recovery causes capping in many products. We can minimise elastic recovery by selecting the right excipients.

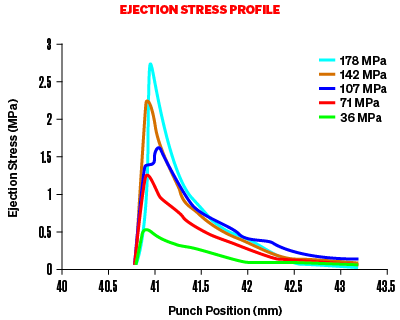
Ejection stress is a measure of how well lubricated the formulation. Poor lubrication results in common tablet defects such as picking, sticking and capping.
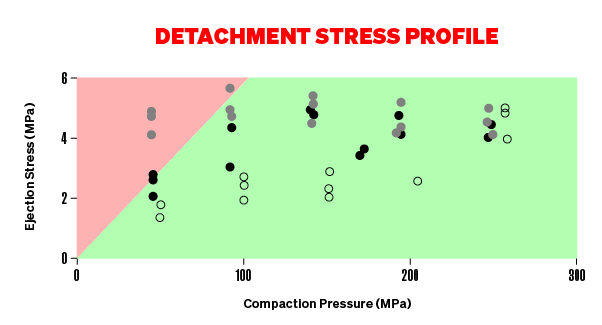
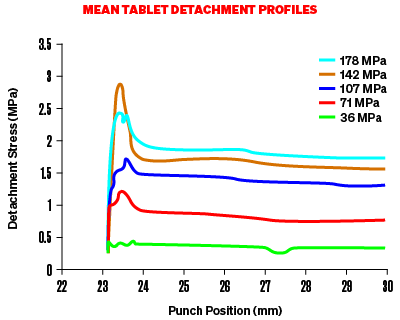
Detachment force is equivalent to take off force and is related to lubrication. High detachment stress values indicate that the formulation is at risk of picking and sticking problems.
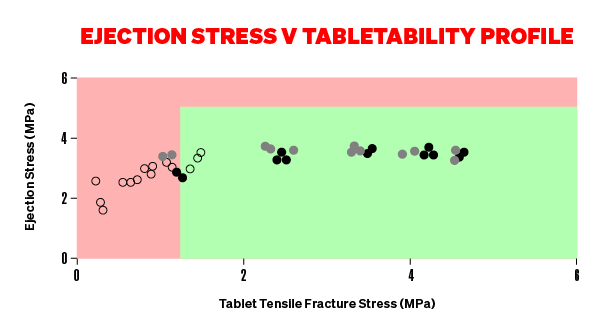
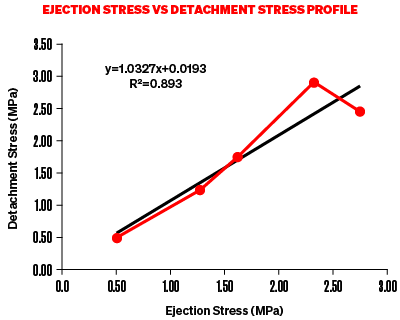
The ejection stress vs tabletability profile provides an ideal target for the compaction behaviour. It is a simple and effective method of visualising and evaluating the effect of various changes a formulation.

Using the G-ratio simplifies your compaction data and helps you to quickly evaluate and compare different materials/formulations.